Microsoft announced that Azure Monitor now has Prometheus integration. It means that Azure Monitor provides full monitoring support not only for AKS related components like AKS worker nodes and pods/containers but also for applications running inside containers. Prometheus is already fully integrated and does not require additional implementation steps but it must be enabled to start scraping metrics. In addition, the Prometheus integration does not issue costs except for data that are stored in the Azure Log Analytics workspace.
Additional information can be found here:
https://docs.microsoft.com/en-us/azure/azure-monitor/insights/container-insights-agent-config
To make the Prometheus integration working and to scrape metrics, there are two steps that first need to be configured properly.
First, it is required that the pod has some annotations specified so that Prometheus can identify those pods to start scraping and how to scrape metrics.
Add the following specifications in the annotations section of the deployment yaml file which will deploy your pods:
[…]
template:
    metadata:
      labels:
        tier: frontend
      annotations:
        prometheus.io/scrape: "true"
 […]
There are additional annotations that can be used to scrape metrics if those scraping settings differ from the scraping default values of the application. Add one or more of the following annotations as required:
– Enable scraping for this pod (already set):
prometheus.io/scrape: “true” / “false”
– If the metrics endpoint is secured then use this to “https” (consider settings the tls config as well):
prometheus.io/scheme: “http” / “https”
– If the metrics path is not /metrics, define it with this annotation:
prometheus.io/path: “/custompath”
– If port is not 9102 use this annotation:
prometheus.io/port: “10000”
Secondly, Prometheus must be enabled to start scraping metrics from the applications running inside pods/containers. This will be done by downloading the ConfigMap here (link).
After, this ConfigMap must be customized as follow:
[prometheus_data_collection_settings.cluster]
  interval = "1m"
  monitor_kubernetes_pods = true
Once this is done and the ConfigMap has been applied using the command kubectl apply -f [Path to ConfigMap], Prometheus starts scraping metrics.
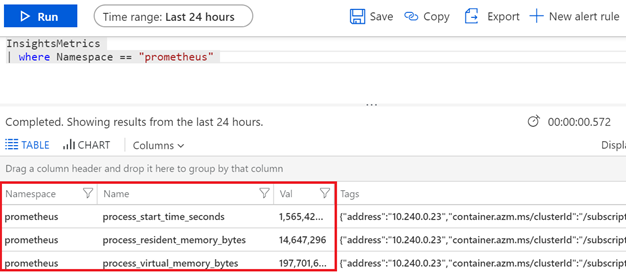
The Azure Log Analytics workspace which is used by AKS should have some information stored in the InsightMetrics table of the ContainerInsights namespace. To verify, run the following Kusto query. Metrics scraping works if a result is returned.
InsightsMetrics
| where Namespace == "prometheus"